
Gain Insight into Behaviour Field in Matomo - matomoexpert

Apr
We are going to Gain Insight into Behaviour Field in Matomo analytics dashboard as it plays a vital role in a deeper analysis of website users. This section gives information about user navigation flow through different pages of the web, the user clicks, using site search, downloading files, clicks on custom events, and browsing the content of the website by tapping on out-links, etc.
All of these actions performed by visitors’ clicks and interactions enable web analysts to improve the content and strategies of websites for better optimization. The analysts can make strong decisions related to their data and content display with the assistance of Matomo’s Behaviour section. Let’s Gain Insight into Behaviour Field in Matomo with the following quick steps:
Pages Navigation:
The Pages navigation in Matomo’s Behaviour section notifies website owners how many pages are viewed by giving the page URL, the most popular pages of our website, and the content most accessed by our users. This will inform analysts where the content of our website is ranking down and which pages are less visited. As a result, they can make adjustments and changes in the content and page display methods.
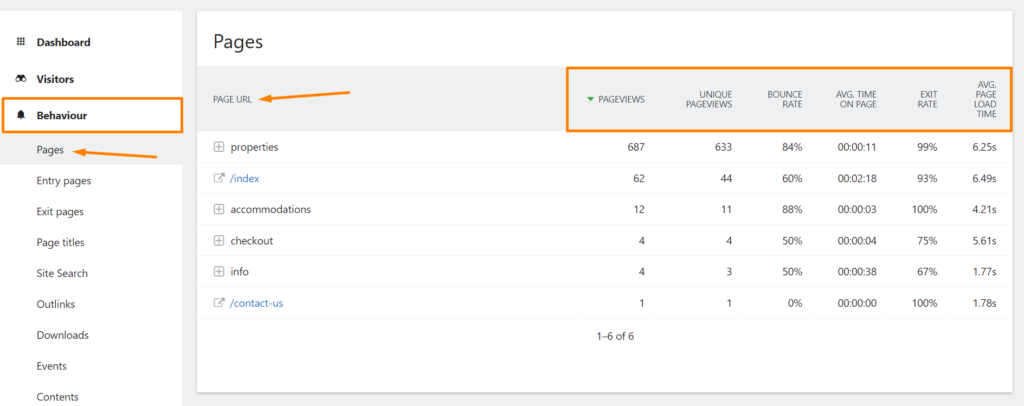
This section contains the following features or key metrics:
Pageviews indicate how many times a visitor has viewed the page.
Unique page views signify the number of pages visited by unique visitors.
Bounce Rate displays how many visitors left the website after viewing a single page like 10%.
Avg Time on Page shows the average time spent on the website by visitors such as 5 min 2 sec.
Exit Rate notifies the percentage of users who exit from a specific page like 5% of users exit the page.
Avg. Page Load Time informs the average time our website takes to load a page for the users.
These metrics display the data as per visitor arrivals and the actions they perform. However, if you are analyzing data then you can click on the sort icon to sort the data from high to low results. These metrics highlight the user journey actions they perform which helps understand how to optimize and maintain your website.
How to Explore the displayed icons:
Furthermore, you can check the Transaction, Page Overlay, Segmented visit log, Page performance report, and Row Evaluation for analyzing detailed data. The icons given in the bottom left corners assist in further customization and analysis. Click on the gear or setting icon to set the data flat, show the total rows, and exclude the low population. You can display a simple table by clicking on the table icon, can display a table with goals metrics, and can check insights. Besides, you can export datasets in other formats and can search for data from a particular account. In short, with the presence of page navigation in the Behaviour section you can see goals tracking and custom events tracking by following Simple Steps to Analyze Your Website’s Performance.

Entry Pages:
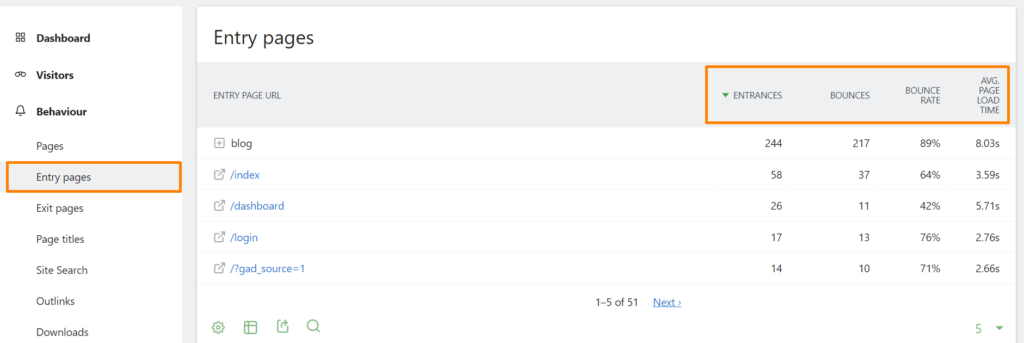
For gaining insights into behaviour field in Matomo, Entry pages are those pages where the user first lands on your website. These are the pages that record the starting point of user’s session. The popular pages of our site that are visited by users involve entry pages. These pages guide us about the popular content, user experience and website performance. Entry pages contain Entrances, Bounces, Bounce Rate, and Avg page load time as key metrics.
Exit Pages:
The point where the visitor leaves our website are called Exit pages. This field shows the pages that have high bounce rate. The reason of exit pages can be low quality or less engaging content and page taking more than specific load time. These pages enables the analysts to make improvements as required and create engaging content and some lead actions that can catch the interest of users.

Page Titles:
Your website pages are assigned by specific titles for each page. These pages are often visible on search engine results and the top of website page. Page titles notify the popularity of varied sections of website that are capturing the attention of users. So, these pages let the analyst know which pages need more improvements to meet the user requirements.

Site Search to Gain Insight into Behaviour Field in Matomo:
Site search report indicates the search queries that a user explores directly on a website. Searches related to specific products, items or content are based on site search. This feature tracks the keywords or pustular terms a visitor uses through site search icon or box. Site search shows the interests, intentions and demands of visitors. With site search tracking website owners can make a strong attachment to the needs and requirements of users, hence they can Track Successful Conversions with Goals and become more responsive.

Outlinks and Downloads:
Outlinks are the external links. When a user clicks on Outlinks these links lead them to another website and leave the current site. Matomo automatically tracks Outlinks. However, you can track them manually by applying CSS class ‘matomo_link’ or you can create a JavaScript custom event trigger ‘trackLink’. Outlinks tracking is essential for knowing where your user go after leaving your site so that you can analyze user behavior out of your site’s bounds. Further, you can follow the blog: Strategies For Data Tracking In Matomo: A Comprehensive Guide for better understanding on how events, interactions, and actions are tracked.

The downloads section tracks the user downloading whether it is a file, an image, any software, or other downloadable content. Matomo displays the number of downloads for each element. Analyzing the popularity of content being downloaded so that we can apply new techniques or methods for optimization is essential feature of this tracking. You can validate downloading by setting up real-time analysis and debug mode.
Events and Contents in Behaviour Field in Matomo:
Matomo Events define some particular interactions in a website from users excluding page views. You can track events in Matomo by using the JavaScript Code snippet:
// Replace “MATOMO_URL” and “MATOMO_SITE_ID” with your Matomo URL and site ID
var _paq = window._paq || [];
_paq.push([‘trackEvent’, ‘Category’, ‘Action’, ‘Label’, 1]);
(function() {
var u=”//MATOMO_URL/”;
_paq.push([‘setTrackerUrl’, u+’matomo.php’]);
_paq.push([‘setSiteId’, ‘MATOMO_SITE_ID’]);
var d=document, g=d.createElement(‘script’), s=d.getElementsByTagName(‘script’)[0];
g.type=’text/javascript’; g.async=true; g.defer=true; g.src=u+’matomo.js’; s.parentNode.insertBefore(g,s);
})();
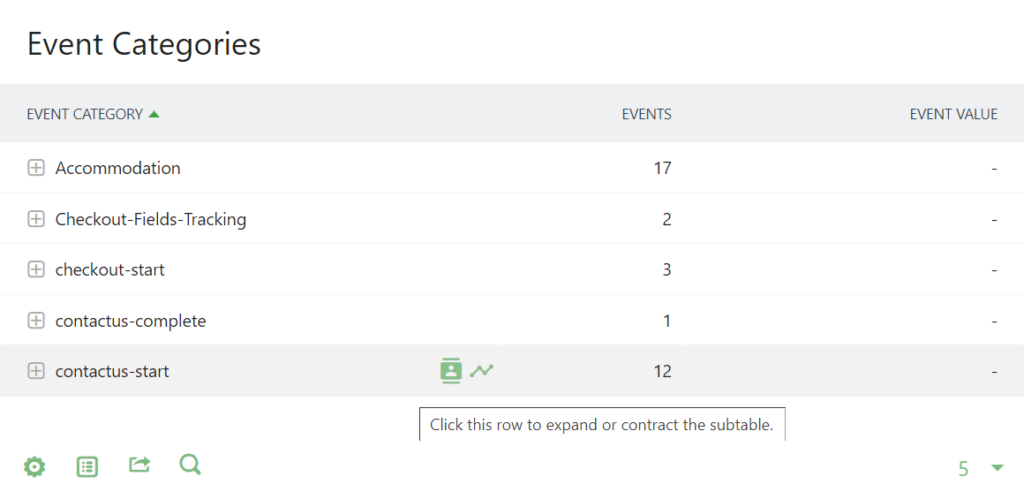
Events are based on: Event Category – Bookings, form submissions, button clicks, etc. Event Action – How many actions a user tapped. Event Value – Assigns a numeric value to an event.
Contents Field displays the user behavior with the content. You can Track Impressions and Interactions of users easily with Matomo Content field. These clicks can be on buttons, links or downloadable items.
Engagement Section within Behaviour Field in Matomo:
You can explore Matomo’s behaviour section with Engagement field within the Behaviour section of Matomo Analytics refers to the interaction and activities of users within your website. Matomo’s engagement section gives a detailed display of visitor’s pathways, actions and engagements that are essential to be analyzed. Its sub-sections include Frequency Overview, Visits per visit duration, Visits per number of pages, Visits by visit number, and Visits by days since the last visit. All these fields. All these metrics are important for understanding User Experience And Website Performance.
Transactions:
The transactions field defines the completed conversions like form submission, bookmarking complete, newsletter submission, etc. It contains information about Tracking Successful Conversations with Goals. Transactions elaborate on to what extent your website is achieving the goal of your business. With the analysis of Transactions, analytics can improve their goals according to user requirements.
Performance Metrics Analysis to Gain Insight into Behaviour Field in Matomo:
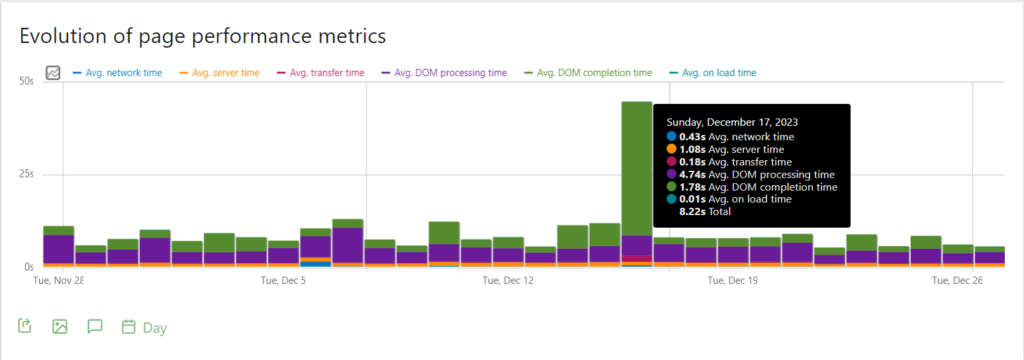
The performance field talks about the page’s performance on how much time a website takes for loading a page and to what extent it is responsive. It shows the Evolution of page performance metrics such as Avg. Network Time, Avg. Server Time, Avg. Transfer Time, Avg. DOM Processing Time, and Avg. On Load Time and the performance of Page URLs and Titles.
User Flow:
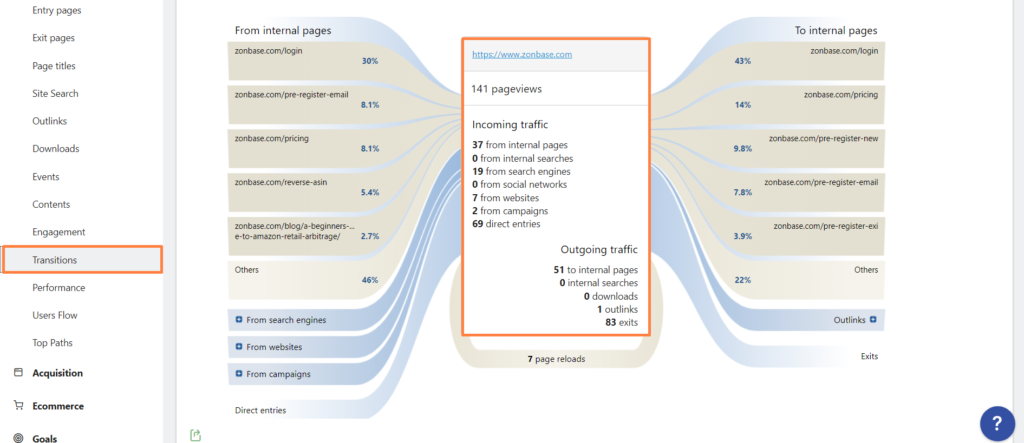
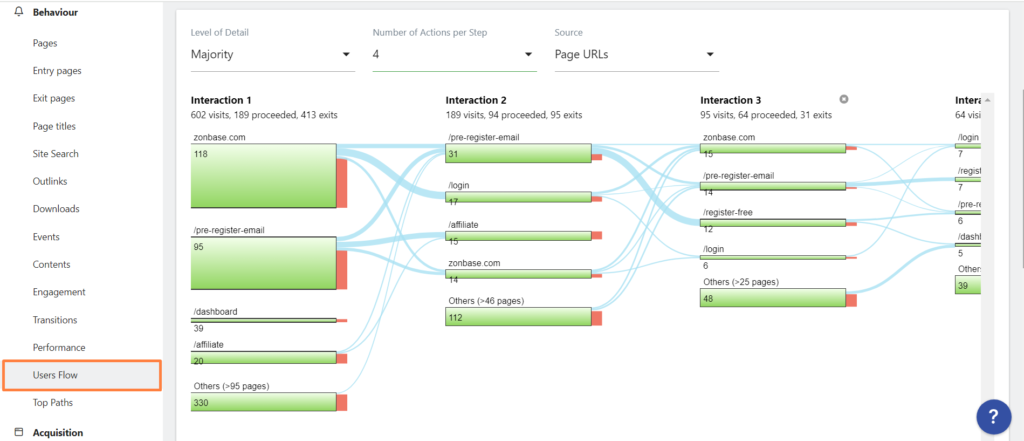
The user flow refers to the paths a user takes while navigating through your website. This field shows visual representation of user journey and steps that he takes form one screen or page to another. The analysts can easily understand the popular routes and drop-offs on their website.
Top Paths:
The top paths metric gives view of paths the users take to explore your site and get their desired content and purpose. It shows user session-based page view tracks. Furthermore, it shows if these top paths lead to goals completion which helps business growth and profit for the website owner. With the analysis of top paths, we can implementation on content improvements, calls-to-actions for better conversion rates.
In summary,
Matomo’s Behaviour section is of high importance for web analysts for thoroughly understanding user experience, interactions, and engagements that further lead to the optimization and performance of website. Optimize your website performance with insights provided in this blog. You can visit the platform MatomoExpert if your beginner and want to get complete understanding of Matomo Analytics and all of its key metrics and sections.
MatomoExpert © 2023 All Rights Reserved