
Jun
9 Ways To Customize Your Matomo Like A Pro
Customize Your Matomo, as a comprehensive web analytics platform, offers a multitude of customizable elements that allow users to tailor the system according to their specific requirements. From core features to additional plugins, custom dimensions, reports, extensions, and integrations, Matomo provides extensive customization options. However, new users might overlook the breadth of choices available.
In this blog post, we will guide you through the process of maximizing the potential of Matomo through custom reports, dashboards, dimensions, and even app design.
In this blog post, we will guide you through the process of maximizing the potential of Matomo through custom reports, dashboards, dimensions, and even app design.
How to Customize Your Matomo Web Analytics
To make significant changes to Matomo, such as creating custom dashboards or installing new plugins, you need to be a Matomo Super User, also known as the Admin. Super Users can grant administrator permissions to additional individuals, expanding the scope of customization for your Matomo deployment. By empowering more users with administrative access, you can foster a collaborative environment where multiple individuals can contribute to tailoring and fine-tuning your Matomo setup according to specific needs and preferences.
However, most feature-related customizations, such as configuring custom reports or adding custom goal tracking, can be performed by all users.
Keeping that in mind, let’s explore how you can tweak Matomo to better serve your website analytics needs:
1) Custom Dashboards:

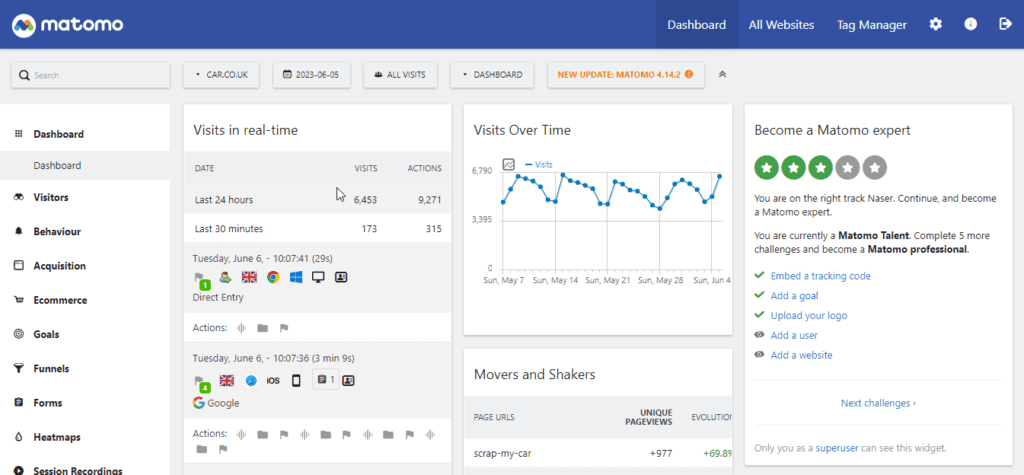
Matomo offers a customizable dashboard with various widgets that display different categories of statistics and key performance indicators (KPIs). You can modify the type, position, and number of widgets on your dashboard, allowing you to create separate dashboard views for different projects, clients, or team members. By designing custom dashboards tailored to specific roles or business units, you can enhance data-driven decision-making and improve efficiency across your organization.
Creating a new dashboard view is a straightforward process. You can choose from different layouts, such as split-page view or multi-columns, and populate the new dashboard area with preferred widgets, including SEO website rankings, visits, conversions and revenue, custom reports, or even code a custom widget area to pull specific website statistics or reporting data. Once created, you can arrange and rearrange everything using the drag-and-drop functionality.
Popular Use Cases for Custom Dashboards:
- Personalized website statistics layout for convenient viewing.
- Streamlined analytics dashboards for a line of business leaders and stakeholders.
- Project- or client-specific dashboards for easy sharing of reports.
- By leveraging custom dashboards, you can create a tailored analytics experience that focuses on the most relevant metrics for your specific needs, enhancing your ability to extract actionable insights from your data.
2) Custom Reports:

The Custom Reports widget in Matomo allows you to create tailored website traffic analyses by combining various dimensions and metrics collected by the platform. These reports save time by presenting specific data in one view, eliminating the need to navigate between multiple reports or toggle through different sections to find relevant information.
For each custom report, you can select up to three dimensions and apply additional quantitative measurements (metrics) to delve deeper into the data. For instance, you can create a custom report to closely examine mobile conversion rates in a specific market using dimensions such as User Type (registered), Device type (mobile), and Location (France), along with metrics like Visits, Conversion Rate, Revenue, and Avg. Generation Time.
The Custom Report widget is a feature offered in Matomo Cloud, providing users with the ability to easily create and utilize custom reports.
Popular Use Cases for Custom Reports:
- Campaign-specific reporting to gain insights into the impact of different promotional strategies.
- Advanced event tracking for conversion optimization.
- Market segmentation reports to analyze different audience cohorts.
- To learn more about creating and analyzing Custom Reports, explore our detailed documentation.
3) Custom Widgets:
At Matomo, we understand that users have varying levels of analytics knowledge and preferences. Some users prefer in-depth reporting dimensions and multi-row tables, while others prefer essential statistics. To cater to both, we have developed widgets – modular components within the reporting interface that can be added, deleted, or rearranged with just a few clicks.
Widgets provide a convenient way to add extra information to your dashboard. You can choose from pre-made custom widgets or even develop your widgets to display custom reports or external data sources, such as offline sales volume. Additionally, Matomo widgets can be embedded into other applications, such as a website CMS or corporate portal.
Popular Use Cases for Custom Widgets:
Displaying key goals, such as new trial sign-ups, on the main dashboard for increased visibility.
Highlighting cost-per-conversion reporting by combining goal and conversion data to effectively manage budgets.
Running omnichannel eCommerce analytics with embedded offline sales data to gain a comprehensive view of your operations.
By leveraging custom widgets, you can personalize your analytics experience and ensure that the information most relevant to your business is readily available
4) Custom dimensions:

Custom Dimensions in Matomo are used to organize website analytics data by specific parameters or characteristics. They act as “filters” that allow you to segment and analyze your data in various ways. For example, you can use custom dimensions to compare conversion rates between registered and guest users or track revenue by device type and location.
There are two categories of custom dimensions in Matomo:
Visit dimensions: These dimensions associate metadata about a user with Visitor profiles, which provide a summary of the information you have about your audience. Reports for visit-scoped custom dimensions are available in the Visitors section of your Matomo dashboard.
Action dimensions: Action dimensions in Matomo allow for the segmentation of users based on specific actions that are tracked within the platform. These actions can include various user interactions such as page views, event completions, downloads, form clicks, and more. By utilizing action-scoped custom dimensions, you gain the ability to further refine your analysis and reporting in the Behaviours section of Matomo.
The number of custom dimensions you can apply to reports depends on your Matomo version, typically ranging from 5 to 15. It’s important to note that custom dimensions cannot be deleted but can be deactivated. Each custom dimension has its own dedicated reports page on your Matomo dashboard.
Popular use cases for Custom dimensions:
- Segmenting reports by users’ screen resolution size to understand website performance on different devices.
- Monitoring conversion rates for different page types to identify the best-performing assets.
- Analyzing user behavior based on custom dimensions to gain insights into specific actions or attributes.
5) Custom scheduled reports:

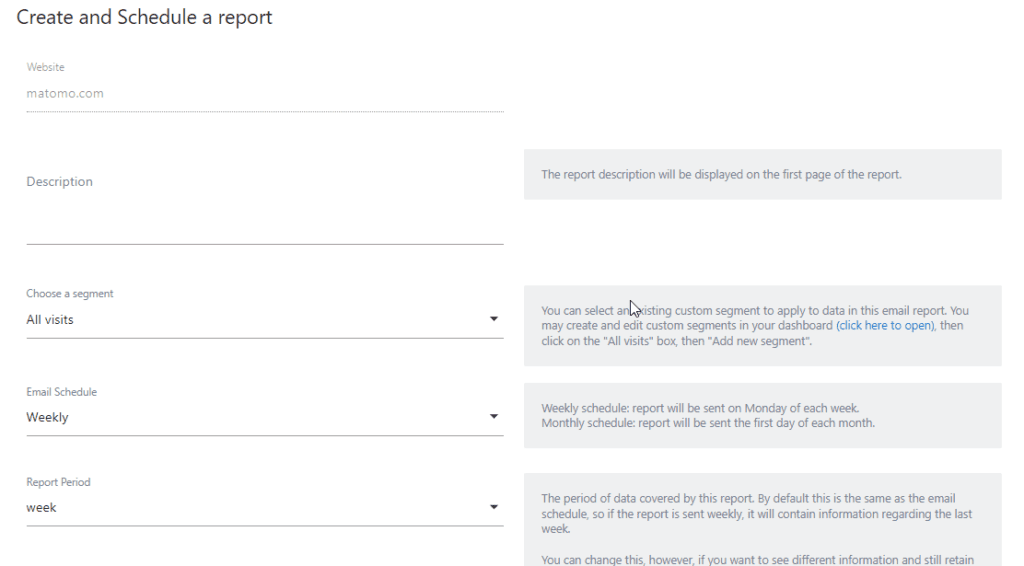
Custom Scheduled Reports in Matomo provide a way to automate the distribution of reports to relevant stakeholders. Instead of manually sending reports, you can set up custom schedules to send reports via email as PDF files, HTML content, or attached CSV documents. You can customize the data included in each report and set the frequency of email dispatches. Matomo takes care of the rest.
Additionally, Matomo allows sharing links to reports as text messages using ASPSMS or Clockwork SMS, enabling easy access to report insights on the go.
Popular use cases for Custom scheduled reports:
- Providing convenient stakeholder reporting on key website KPIs.
- Automating client updates to keep clients informed and reduce workload.
- Facilitating easy data downloads for custom analysis with business intelligence tools.
- These features in Matomo help improve efficiency, ensure the timely distribution of data, and empower users to make informed decisions based on analytics reports.
6) Custom alerts:
Custom Alerts in Matomo are designed to keep you updated on important analytics events. Unlike Custom Reports, which provide a comprehensive snapshot of analytics data, alerts are more focused on tracking individual events. They are useful for monitoring specific occurrences such as significant traffic increases from a particular channel, the emergence of new 404 pages, or the achievement of major goals like reaching 1,000 sales in a week.
Custom Alerts provide a convenient way to stay informed about your website’s performance and promptly address any issues or milestones. You can receive these alerts via email or text message within minutes.
To avoid overwhelming your inbox, it is recommended to use Custom Alerts for a select few use cases (around 3 to 5) and schedule custom Email Reports to receive broader web page analytics.
Popular use cases for Custom alerts:
- Monitoring sudden drops in revenue to investigate the underlying cause and take prompt action to resolve any issues.
- Being notified of traffic spikes or sudden dips to better manage your website’s technical performance and optimize user experience.
- Keeping track of specific events or metrics that are crucial to your business goals and receiving alerts when they occur.
7) Goals:
Goals in Matomo allow you to define and measure quantifiable actions related to your business objectives. A goal represents an action you want to track, such as a specific page visit, form submission, or file download. By setting up goals, you can create a sales funnel that represents the sequence of actions users should ideally take to convert.
Goals and Funnel Analytics together provide a powerful and customizable tool for understanding how visitors navigate your website, identifying what prompts them to take action, and determining where they may lose interest and bounce off.
In Matomo, you can track multiple goals simultaneously, monitor multiple conversions per visit (for example, when a user requests two content downloads), and assign revenue targets to specific goals.
For Matomo Cloud users, there are additional premium features available, such as Funnels and Multi-Channel Conversion Attribution. On-premises Matomo users can access these features as paid plugins via the Matomo Marketplace.
Popular use cases for Goals:
- Tracking newsletter subscriptions to maximize subscriber growth and evaluate the effectiveness of your email marketing campaigns.
- Monitoring conversions for gated content, such as eBooks, to understand how each asset performs and optimize content strategies.
- Analyzing the volume of job applications per post to gain insights into the effectiveness of your HR marketing efforts and make informed decisions.
- By leveraging Custom Alerts and Goals in Matomo, you can gain valuable insights into your website’s performance, identify areas for improvement, and make data-driven decisions to optimize your online presence.
8) Themes:
Customizable Themes for Matomo On-Premise allow you to give your Matomo app a unique visual appearance. The Matomo community offers free themes that can be downloaded and installed with a few clicks. These themes let you customize your Matomo installation with minimalistic, dark, or traditional looks.
If you have HTML/CSS/JS knowledge, you also have the option to design your own Matomo theme. Matomo is an open-source project, interface customization is not restricted, and users are encouraged to showcase their creativity.
9) White labelling:
Additionally, Matomo supports white labeling, which means you can distribute the Matomo product to others under your brand. This feature is particularly useful for web design agencies and marketing services providers. Marketing services companies may provide reporting widgets, funnel analytics, and unsampled data, web design firms may pre-install GDPR-friendly website analytics.
In addition to selecting a custom theme, you can align Matomo with your brand through various customization options, including:
- Customizing the product name to reflect your brand identity.
- Choosing custom header and font colors that match your brand’s visual style.
- Changing the tracking endpoint to a domain of your choice.
- Removing links to Matomo.org to create a seamless experience for your users.
- To simplify the process of customizing and setting up Matomo according to your branding requirements, Matomo offers a White Label plugin. It also enables you to share embedded Matomo widgets, further enhancing the integration of Matomo with your brand.
Overall, the customizable themes and white labeling options in Matomo empower you to create a visually appealing and branded analytics solution for your organization or clients.
At MatomoExpert, we provide a comprehensive service dedicated to customizing your Matomo dashboard according to your unique needs and preferences. We understand that every organization has different metrics, reporting requirements, and priorities. That’s why we offer a range of customization options, including widget placement, visualization choices, date range selection, metric preferences, segment creation, goal tracking, alert notifications, and multi-domain reporting. With our expertise and personalized approach, we help you harness the full potential of your Matomo dashboard, empowering you with actionable insights and enabling data-driven decision-making.
Categories
- blog (45)
Latest News
Blog Archives
Tag Cloud
MatomoExpert © 2023 All Rights Reserved