
Discover Matomo's Visitor Section Guide - matomoexpert
Apr
In this guide, we will visit the Visitor menu in Matomo. This particular section is highly essential to be analyzed as it gives insights into user behavior and experience. Visitor analytics help website builders or owners make better data-driven decisions for optimizing their site’s performance, achieving required goals, and developing the growth of their business. In this blog, we will break down all the key metrics of visitor menus and their importance for user experience and website performance. You can visit the blog: Best Practices: Guide To User Experience And Website Performance – MatomoExpert for further understanding.
How to Access Visitor Section:
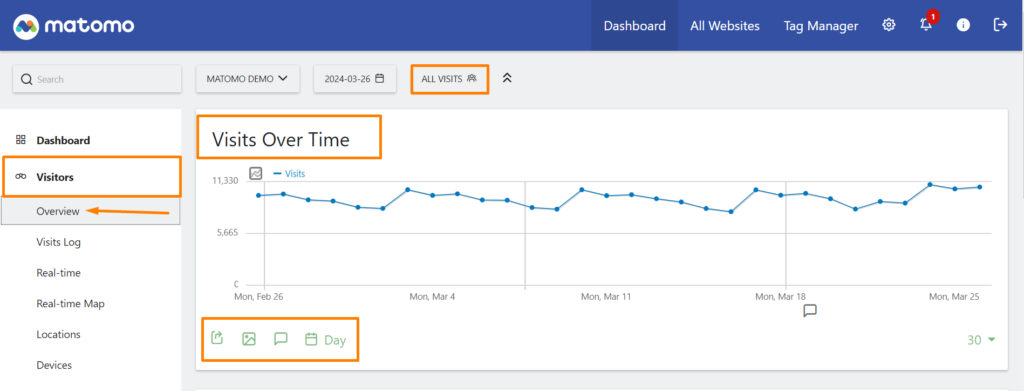
Go to Matomo Dashboard and click on Visitors Filed in the drop-down menu. It will open the visitor section and sub-menus of this section.
1 – Overview Menu:
Right down the visitors is the display of the visitor’s overview menu field. You can analyze this field by selecting your particular data and its status. This is divided into two parts:
Visits Over Time:
This section is based on a line chart visualizing the evolution of data over time. This section allows comparison between varied metrics to understand the trends and functionalities. It offers data export, annotation, and change period options for detailed analysis of your site’s visitors.
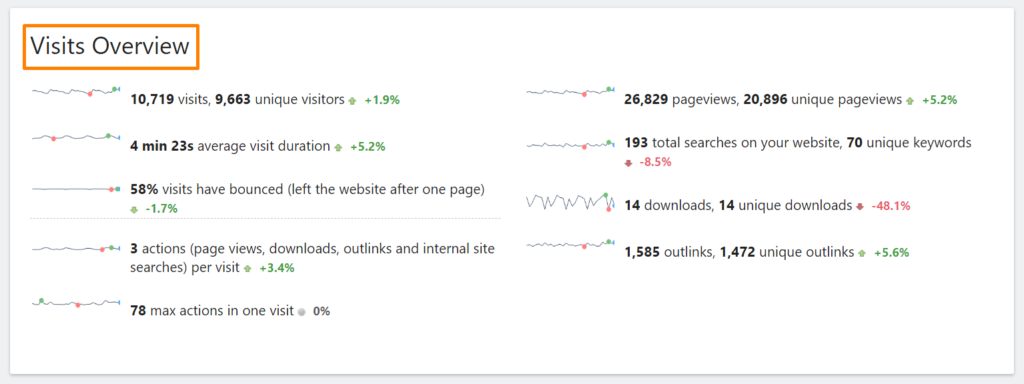
Visits Overview:
The part contains the collective short detail analysis of all the key metrics including Visits, Unique visits, Pageviews, Unique Pageviews, Avg. Visit Duration, Total searches on your website, unique keywords, bounce rate, downloads, unique downloads, actions per visit, out links, unique out links, max actions in one visit. These metrics with line evaluation contains the performance of metrics selected by the user required data period.
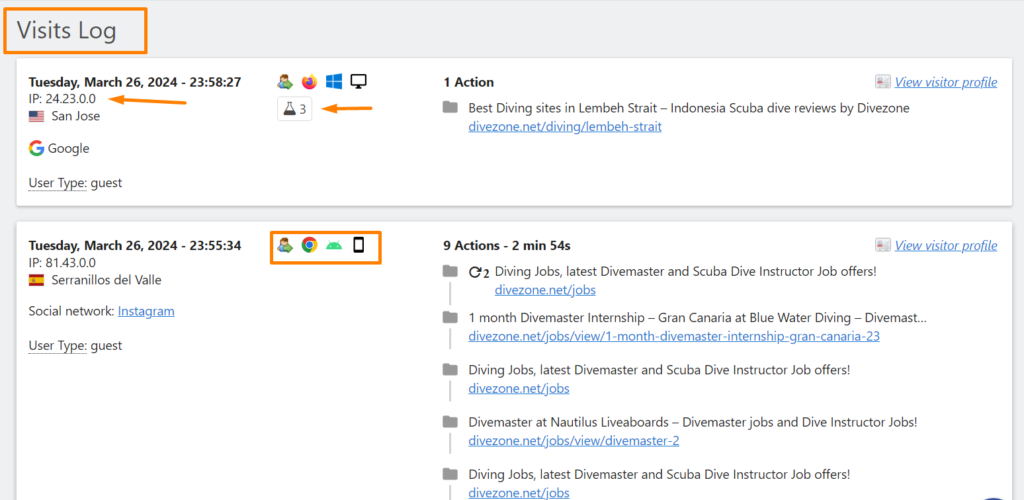
2 – Visits Log Field:
The visits log field in the visits section provides information on every single individual visitor and his interaction with your website. This section helps analyze real-time actions performed by users. You can save the User IP Address and User ID in case a user has logged in to Matomo and for this reason, you can distinguish between unique visitors and visitors. Furthermore, the visits log gives details about the user’s location and the browser he is using. It displays the page views and actions performed by the user. You can see if any of the users have completed the set goals that help you analyze how goals tracking improves your site’s performance.
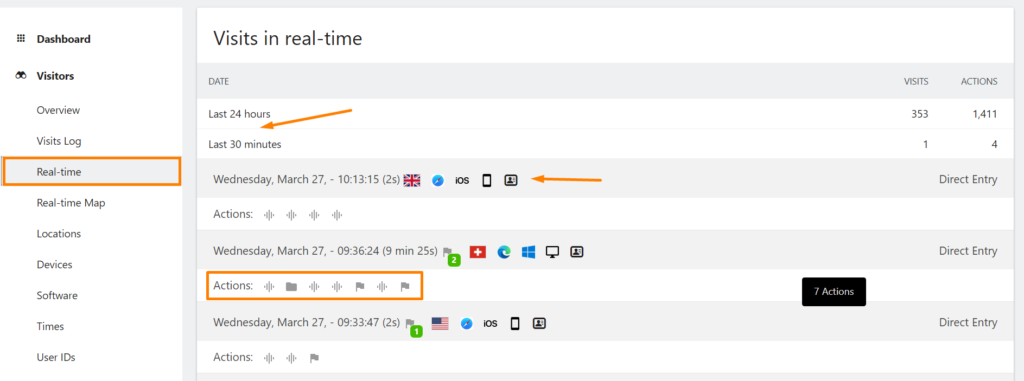
3 – Real-Time:
The real-time menu field within the visitor section symbolizes the current happenings on website as a result of visitors interactions and actions. This field provides information about the user’s time spent on the site, pages visited by the user, and the geographical location of the user. Real-time displays the events that are being tracked. This field helps analysts of the site examine the custom event tracking like form submission, booking completion, downloads, sign-ups, etc. In this way, it becomes easy to check the performance of the website.
4 – Real-Time Map:
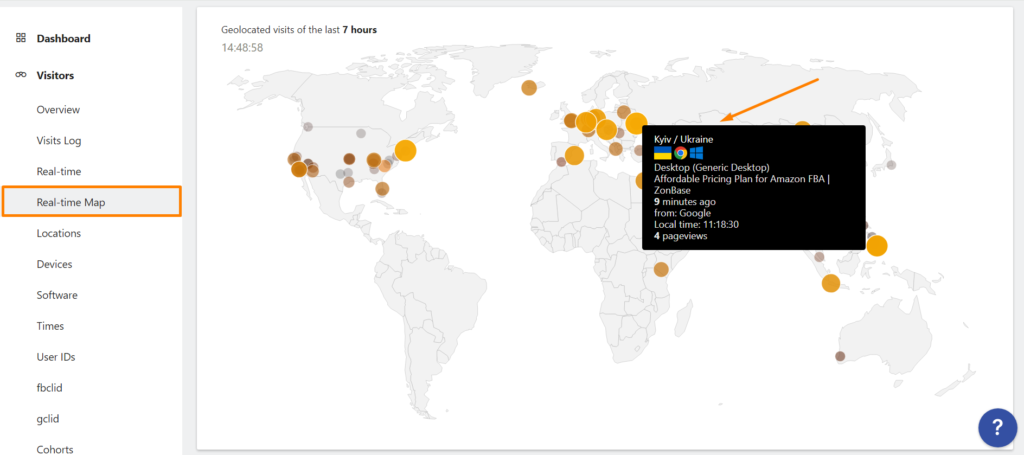
The real time map field under visitor’s section indicates visual representation of user locations device, time, pages viewed by visitors, total number of active visitors, and current activities in a dynamic way. This metric is useful in essence that we can increase our marketing campaigns more effectively. Through real-time mapping, we can analyze the global reach and popularity of our website. This displays the map of the entire world but we can click on a specific country to view its detailed actions and preferences. It becomes easier for analysts to track impressions and interactions.
5 – Visits Locations:
The locations section is divided into sub sections that indicates the user’s geographical locations and their preferences. Here are the sub suctions of locations:
- Map Visualization
- Country Break down
- Continent and Region
- City
- Web Browser Language

All these sections display where the visitors of the website are exiting and then website owners can analyze the interest of each location’s users. They can set the language change option for visitor enhancement. Besides, they can target audience based on local organizations for the development and growth of their business.
6 – Visits Device:
The visitor device field indicates the analysis of the website based on the device information of the user. With device analysis website owners can gain insights into the better layouts, designs, and content arrangements of their sites. This section provides information on the following metrics:
- Device Type
- Device Model
- Device Brand
- Screen Resolution

7 – Visits Device:
The software section helps analyze the software environment and technological interest of users. This section is important in a way that website administrators can gain insights into website optimization and compatibility. Following are the key components of the software section of the visitors’ menu:
Operating System Versions:
The operating system versions section displays the versions such as Windows, macOS, Linux, Android, and iOS. This can inform us about the top platforms that access the website.

Browsers:
This section contains different brewers like Chrome, Firefox, Safari, Internet Explorer, Edge, etc. You can better optimize your websites if your are familiar with browsers used by your site’s visitors. You can follow our guide Simplifying Tech Solutions For Your Business in this connection.

Configurations and Browser Engines:
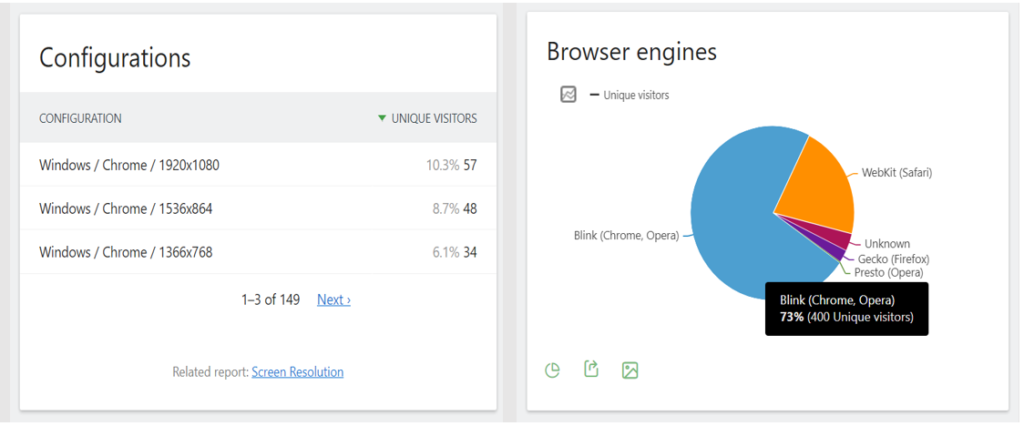
You can analyze browser configurations for more comprehensive analysis of your website performance and ranking. Configurations further help analyze the screen resolution of your visitors. Whereas the browser engines highlight how website is rendering. It includes WebKit, Trident, Gecko, KHMTL, Blink, and Presto.
Browser Plugins:
Browser Plugins are the installed extensions or adds-on present on users browsers. This filed let the analysts know where the issues or discrepancies are preventing data tracking in Matomo. These plugins can be ad blockers, privacy tools etc. Hence, the browser plugins tracking enables the website owners to be attentive because these plugins may display inaccurate data.

Finally, we have thoroughly visited Matomo’s Visitor section and its metrics. Matomo’s visitor section plays vital role in analyzing user engagement, behavior, preferences and requirements. By examining visitor section, we can have a complete familiarity with our website’s users and their experience. You can see what actions are performed on your website, and how many goals you have achieved through users, and you can visit each individual’s session. This field enables website owners to make adjustments related to content, design, and functionalities for flourishing their business. For more details, you can visit our blog Simple Steps to Analyze Your Website’s Performance.
MatomoExpert © 2023 All Rights Reserved